

Disclosure: This analysis uses public NAIC quarterly and annual statutory statements, processed through PIE, Valhalla Consultancy’s Payer Intelligence Engine. Every figure below that we computed ourselves, including the full-year projection, the mix test and the one-carrier adjustment, is labeled as ours and the arithmetic is shown in the methodology notes.
TL;DR
The five main lines combined posted a first-half 2026 loss ratio of 86.9%, 2.0 points better than H1 2025 and within a point of H1 2023 (86.0%).
For the first time in our data, which begins in 2023, premium per member grew faster than cost: 11.8% against 9.2%. In H1 2024 and H1 2025, cost outgrew premium by about 2 points each year.
Individual moved most (down 6.8 points to 79.8%), on premium growth of 18.7% against cost growth of 9.4%. Medicaid improved least among the segments that improved, with premium and cost both up 12-13%.
Combined inpatient admissions per 1,000 are up 13%, but one large carrier’s filings account for much of it. Excluding it, Medicare Advantage admissions are down about 3%.
The shift in membership between segments explains almost none of the improvement: holding 2025’s mix constant moves the combined loss ratio by 0.03 points.
If 2026 follows the June-to-December pattern of the last three years, the five lines would close roughly 2 to 3 points better than 2025. That is a projection, not a forecast, and Individual is the segment most likely to break it.
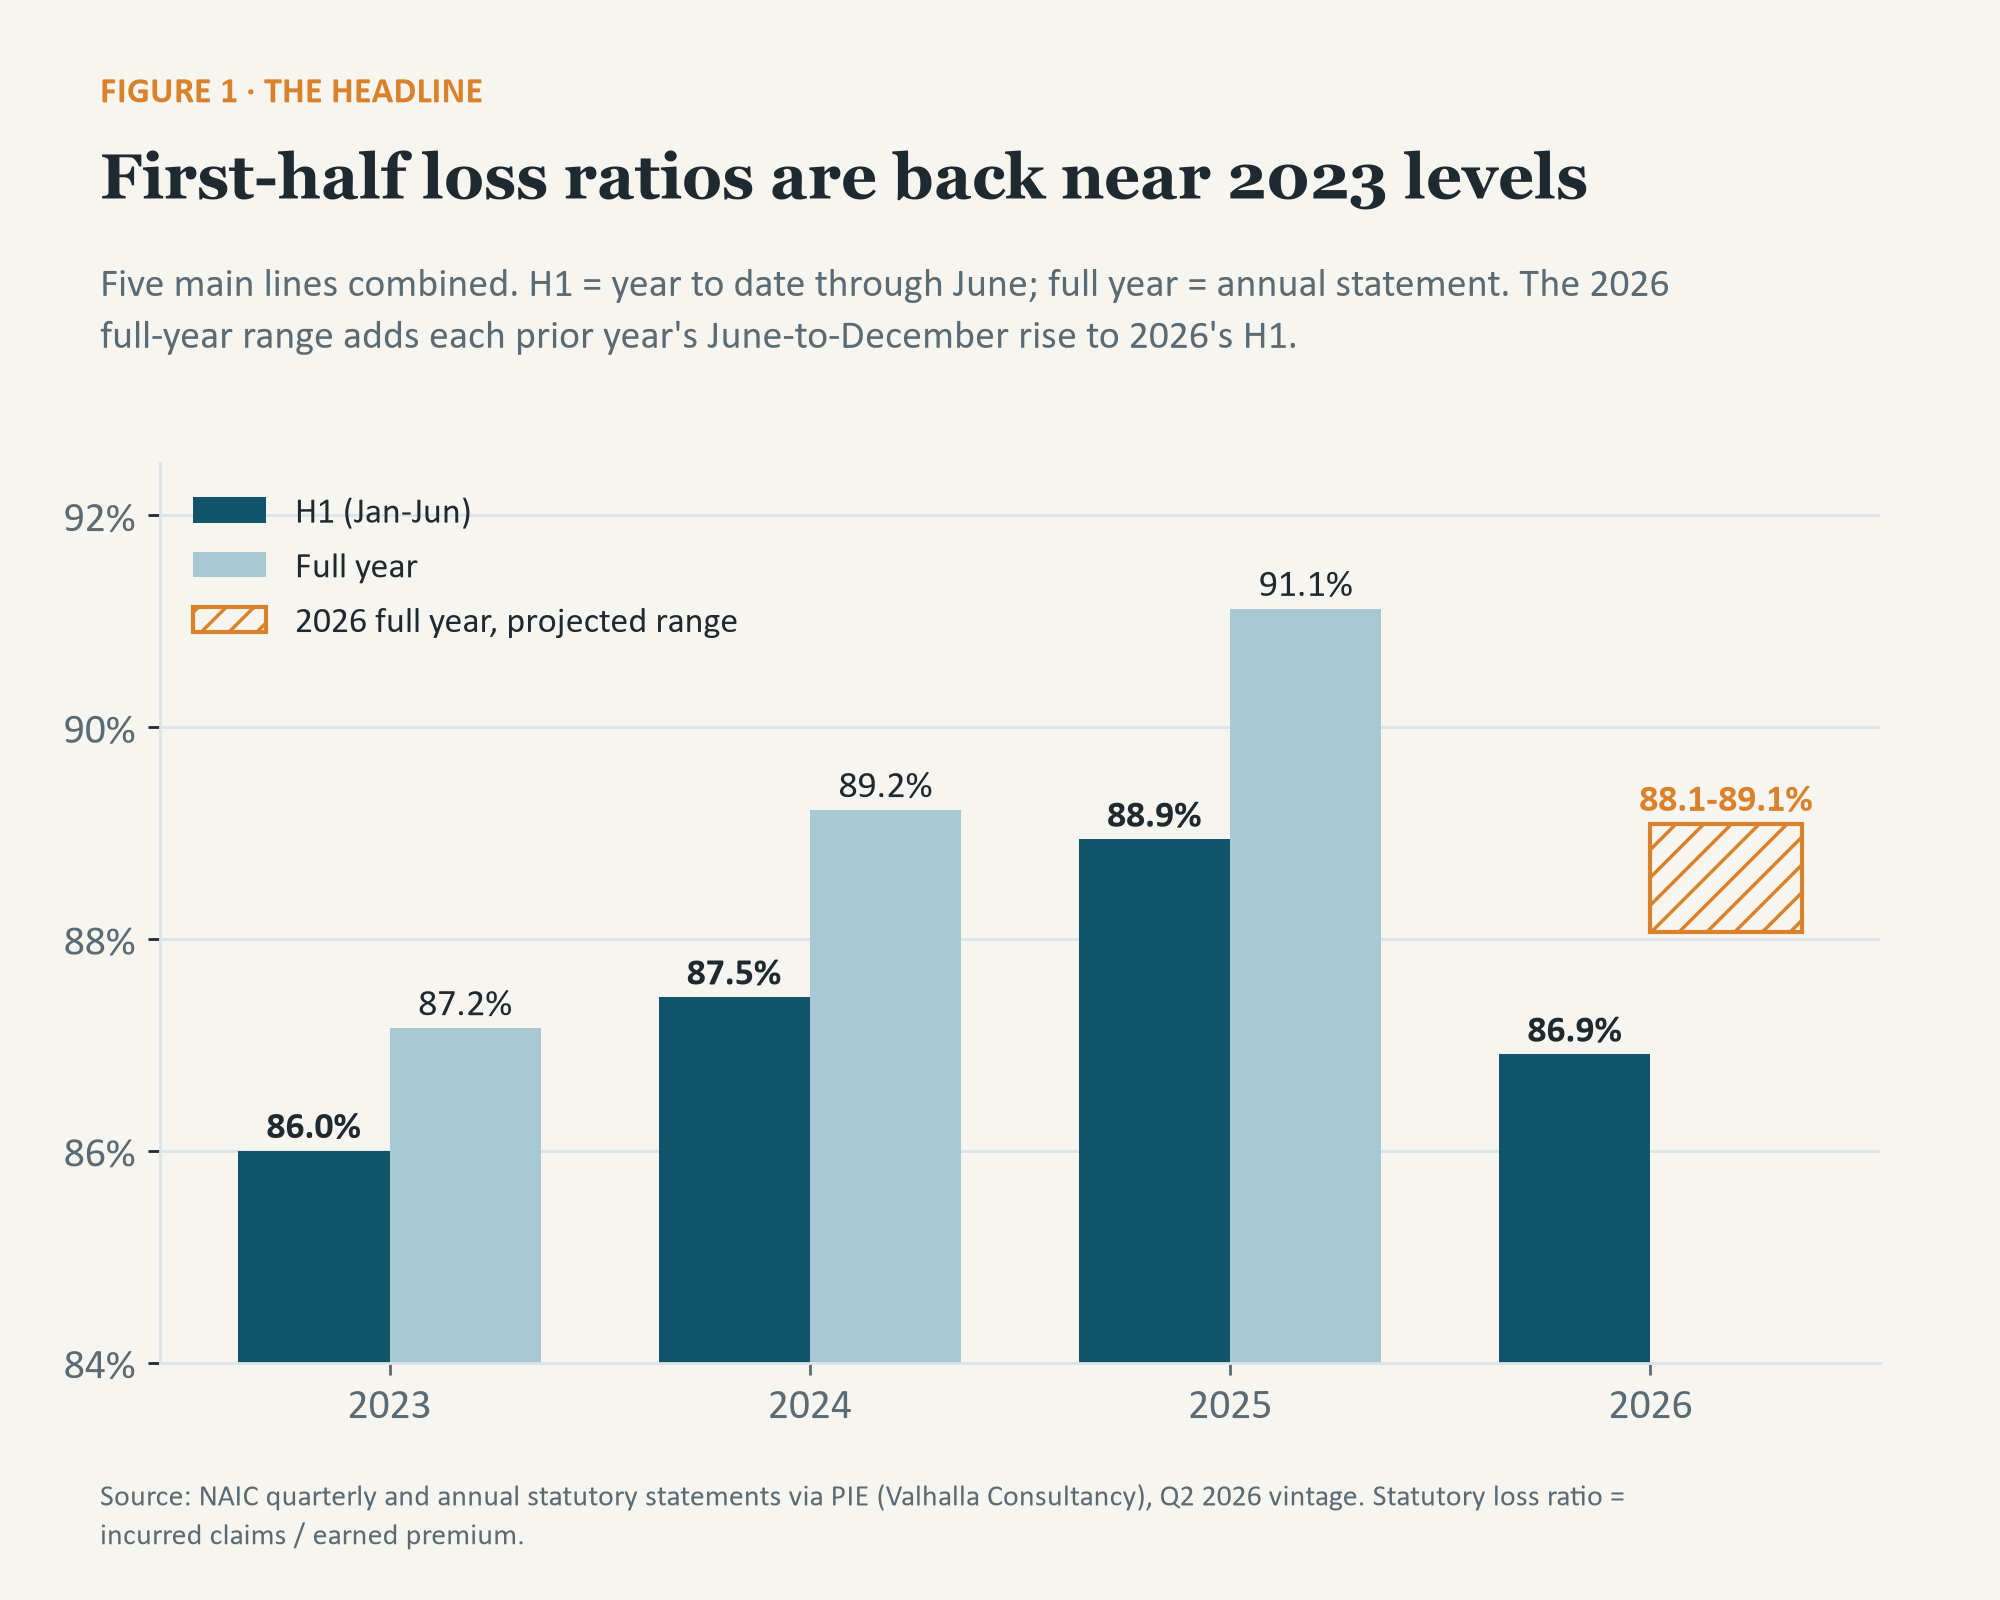
1. The first half of 2026 looks more like 2023 than 2025
Across Medicare Advantage, Medicaid, Individual, Group and the Federal Employees Health Benefits program, carriers paid out 86.9 cents in incurred claims for every dollar of premium earned between January and June. That compares with 88.9 cents a year ago, 87.5 in 2024 and 86.0 in 2023. The industry has given back most of the deterioration of the last two years, at least through June.
The first half is not the year. In each of the last three years the loss ratio rose between June and December, and the rise has grown: 1.2 points in 2023, 1.8 in 2024 and 2.2 in 2025. We come back to what that means for 2026 in section 6.
These are statutory loss ratios, incurred claims over earned premium as filed. They will read below the medical loss ratios carriers report under the ACA, which adjust both numerator and denominator.
2. Four of five segments improved, and Individual moved most
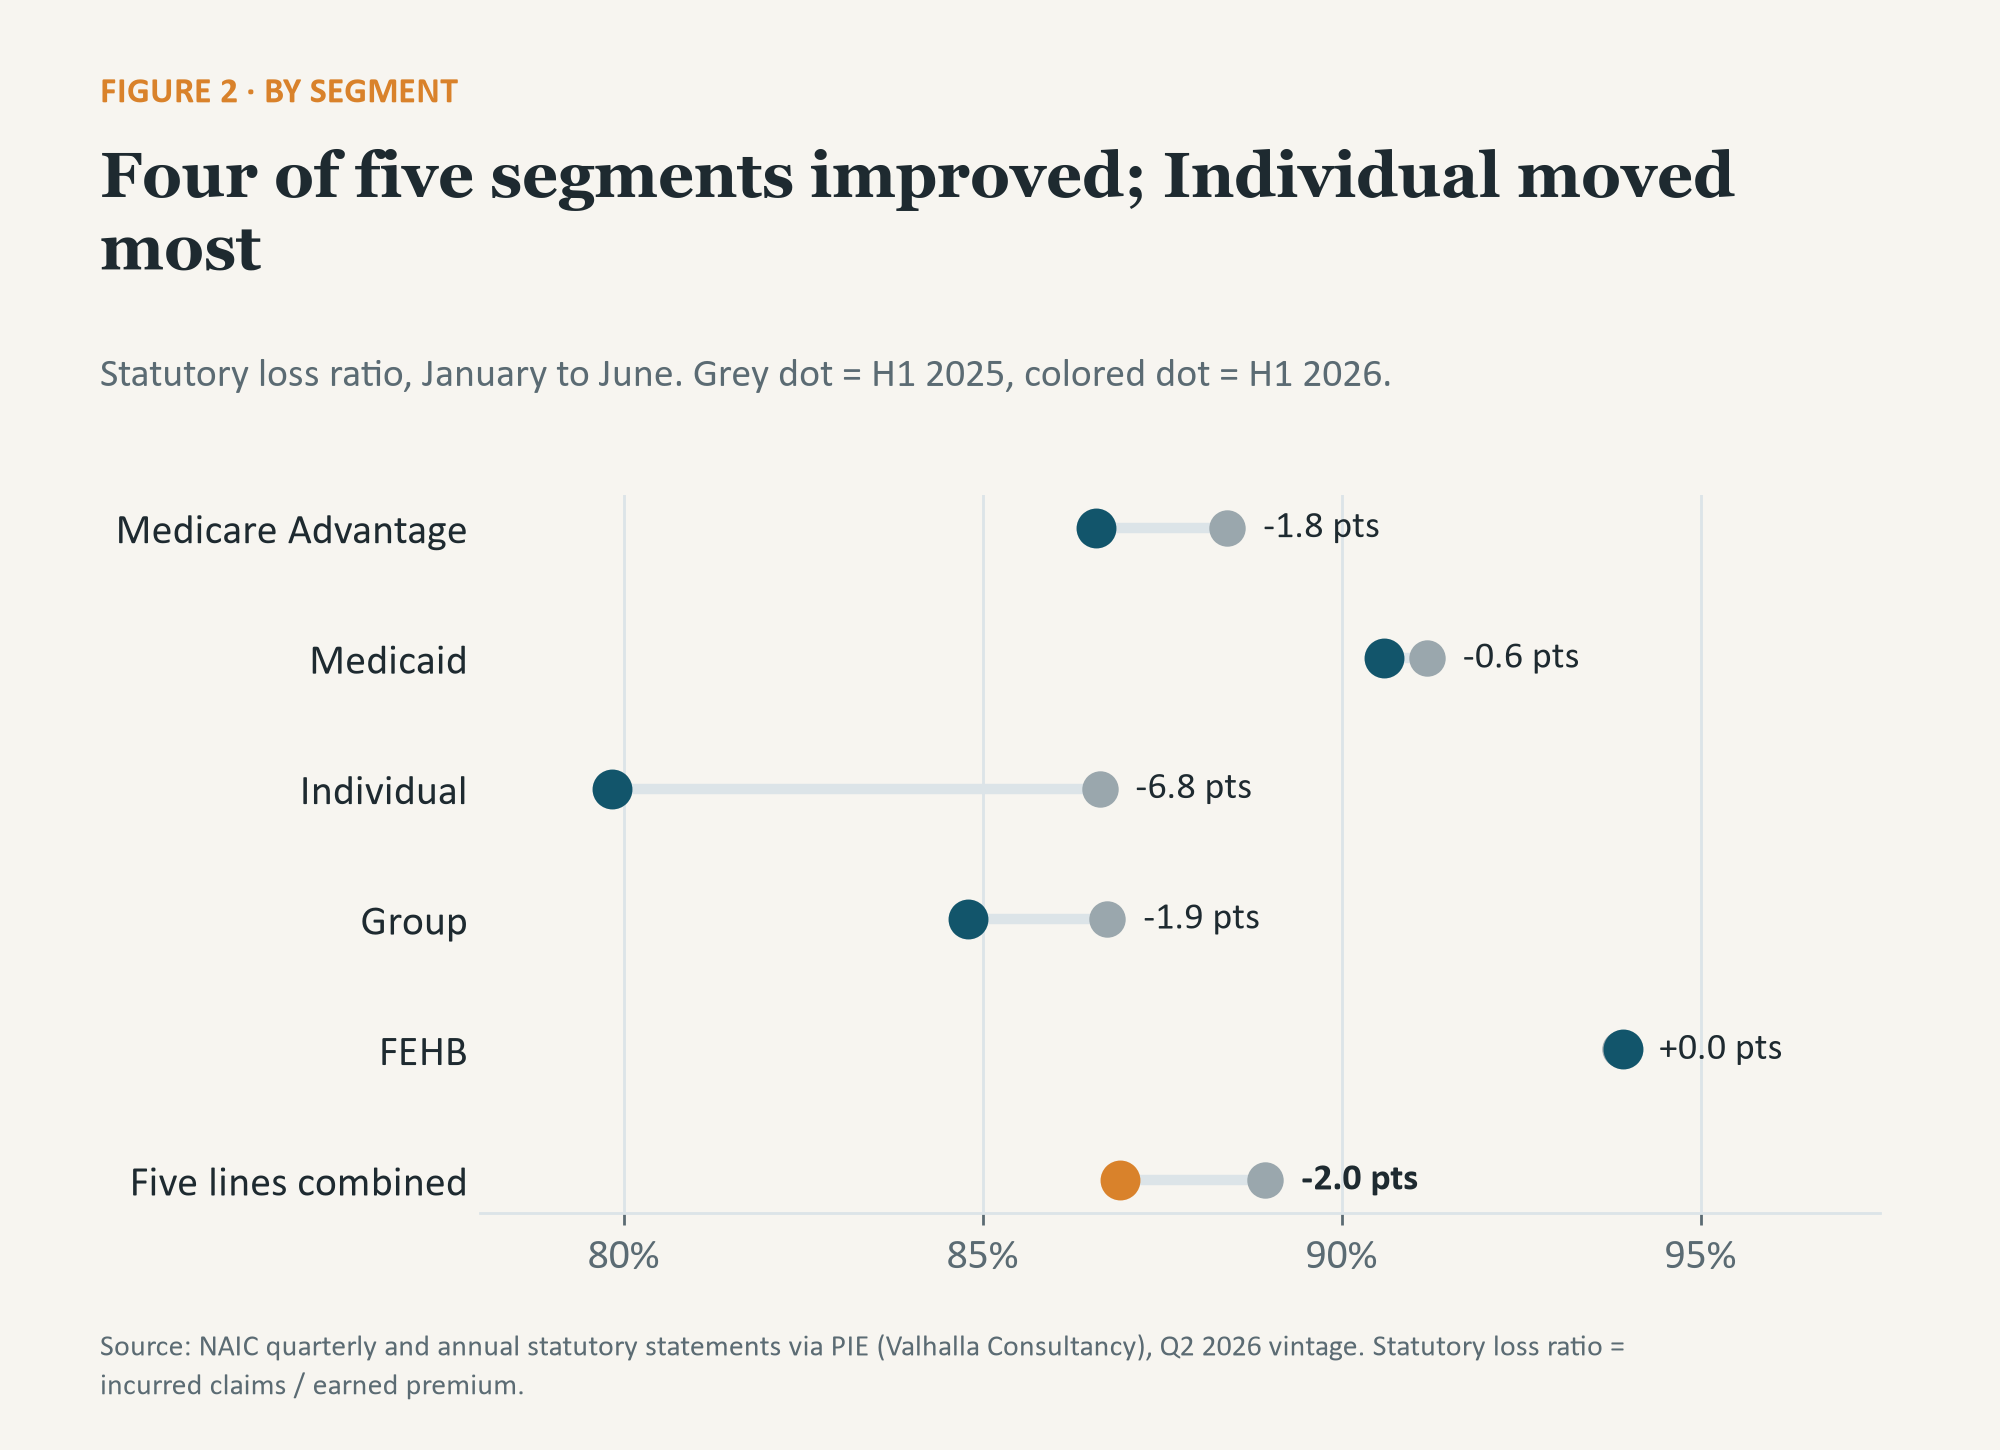
Individual fell 6.8 points to 79.8%. Group and Medicare Advantage each improved by just under 2 points, to 84.8% and 86.6%. Medicaid improved by 0.6 points to 90.6%. FEHB was flat at 93.9%, which leaves it with the thinnest margin of the five to cover administrative cost.
We checked whether any of this is an artifact of which plans filed. Restricting the comparison to plans that filed in both years, which covers 96% of first-half covered lives, gives the same direction and nearly the same size in every segment: Individual down 6.7 points, Group down 2.0, Medicare Advantage down 1.8, Medicaid down 0.5 and FEHB unchanged.
3. Premium is outgrowing cost for the first time in our data
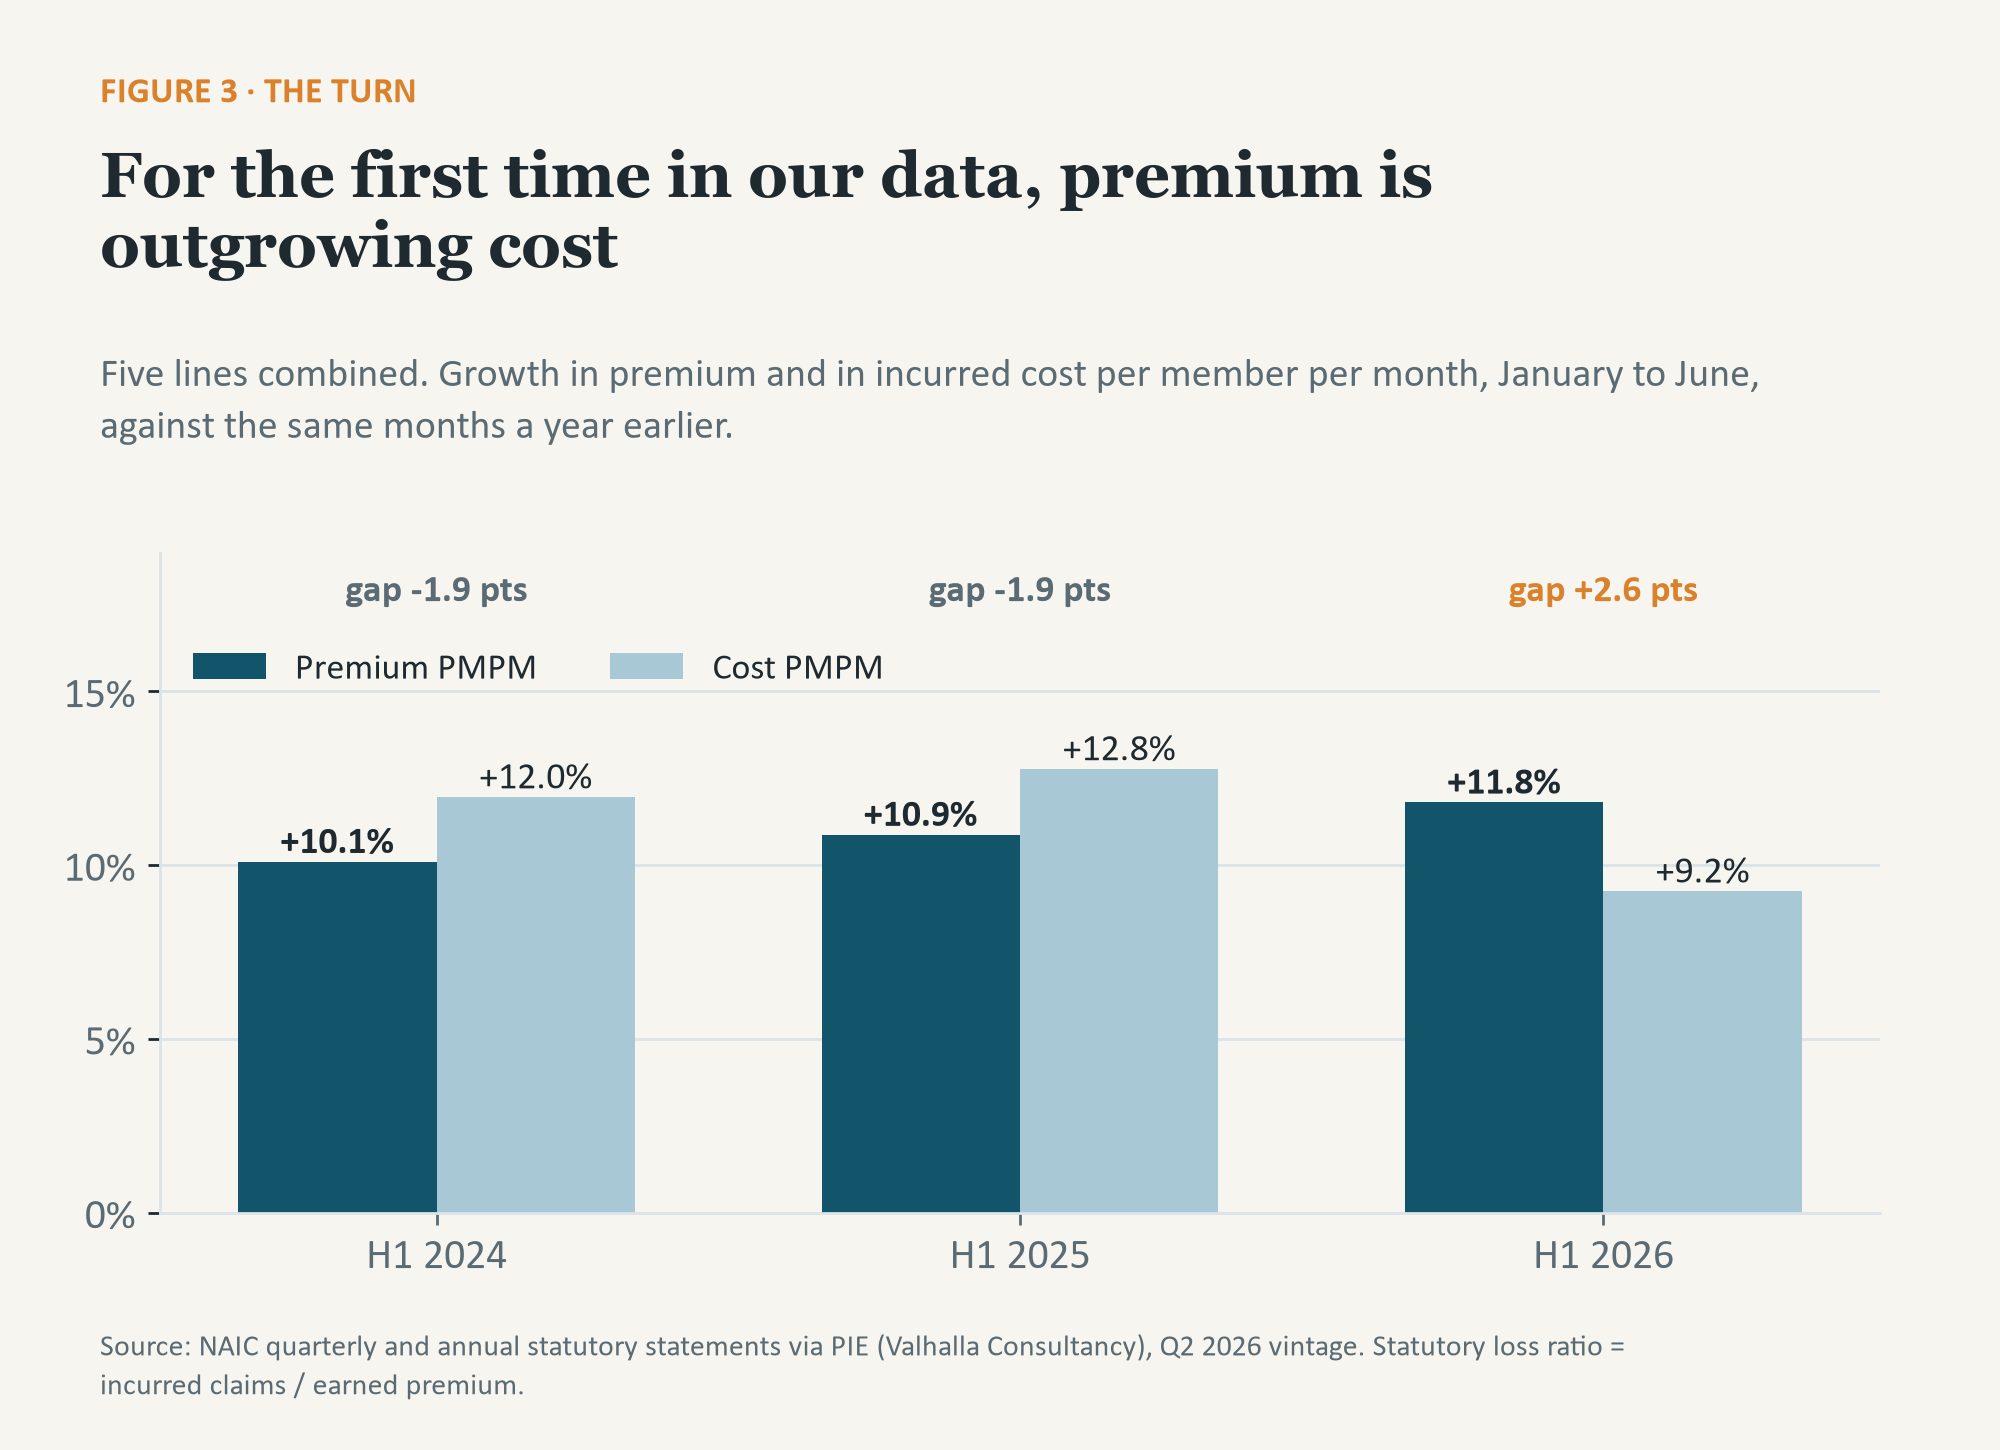
The loss ratio moves when premium and cost grow at different speeds. In the first half of 2024, premium per member across the five lines grew 10.1% and cost per member grew 12.0%. In 2025 it was 10.9% against 12.8%. In 2026 the order flipped: premium grew 11.8% and cost grew 9.2%.
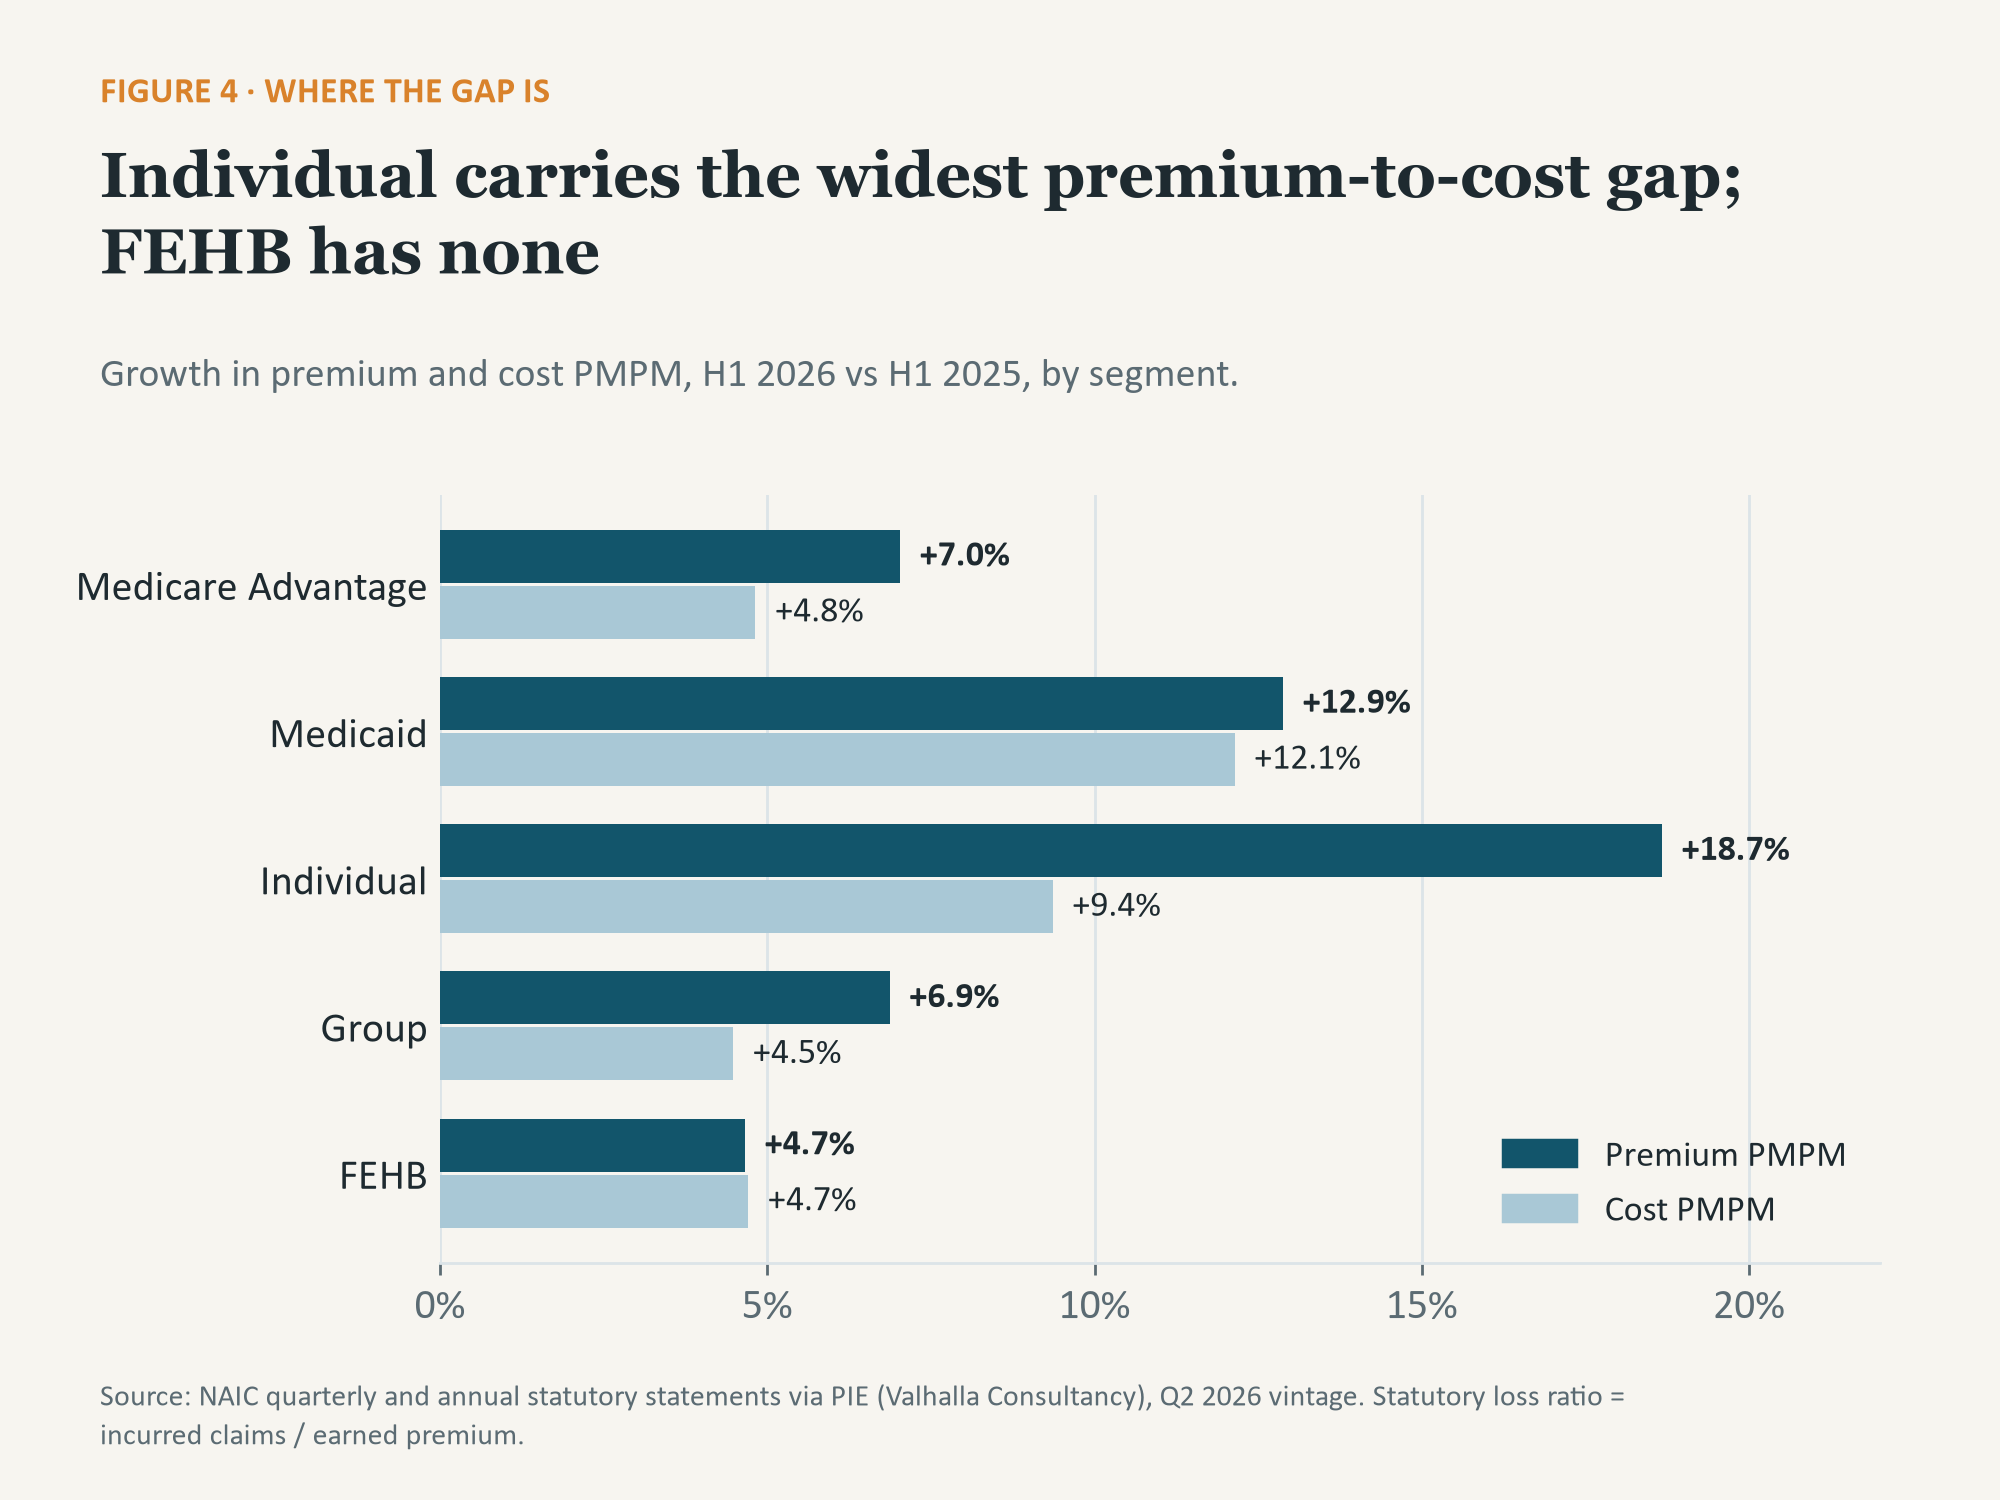
The gap is widest in Individual, where premium per member rose 18.7% against 9.4% for cost, on roughly 20% fewer members than a year ago. Medicare Advantage premium rose 7.0% against 4.8% for cost. In Medicaid the two moved almost together, 12.9% against 12.1%, so the segment’s small improvement rests on a gap of under 1 point. FEHB premium and cost both rose 4.7%.
Group is worth a closer look, because its gap comes from the cost side. Group premium per member grew 6.9%, close to the 6.4% of a year ago. What changed is cost: 4.5% growth this year against 9.4% in the first half of 2025. The improvement in Group is slower cost growth, not heavier pricing.
4. Reported admissions are up, but one filer drives much of the increase
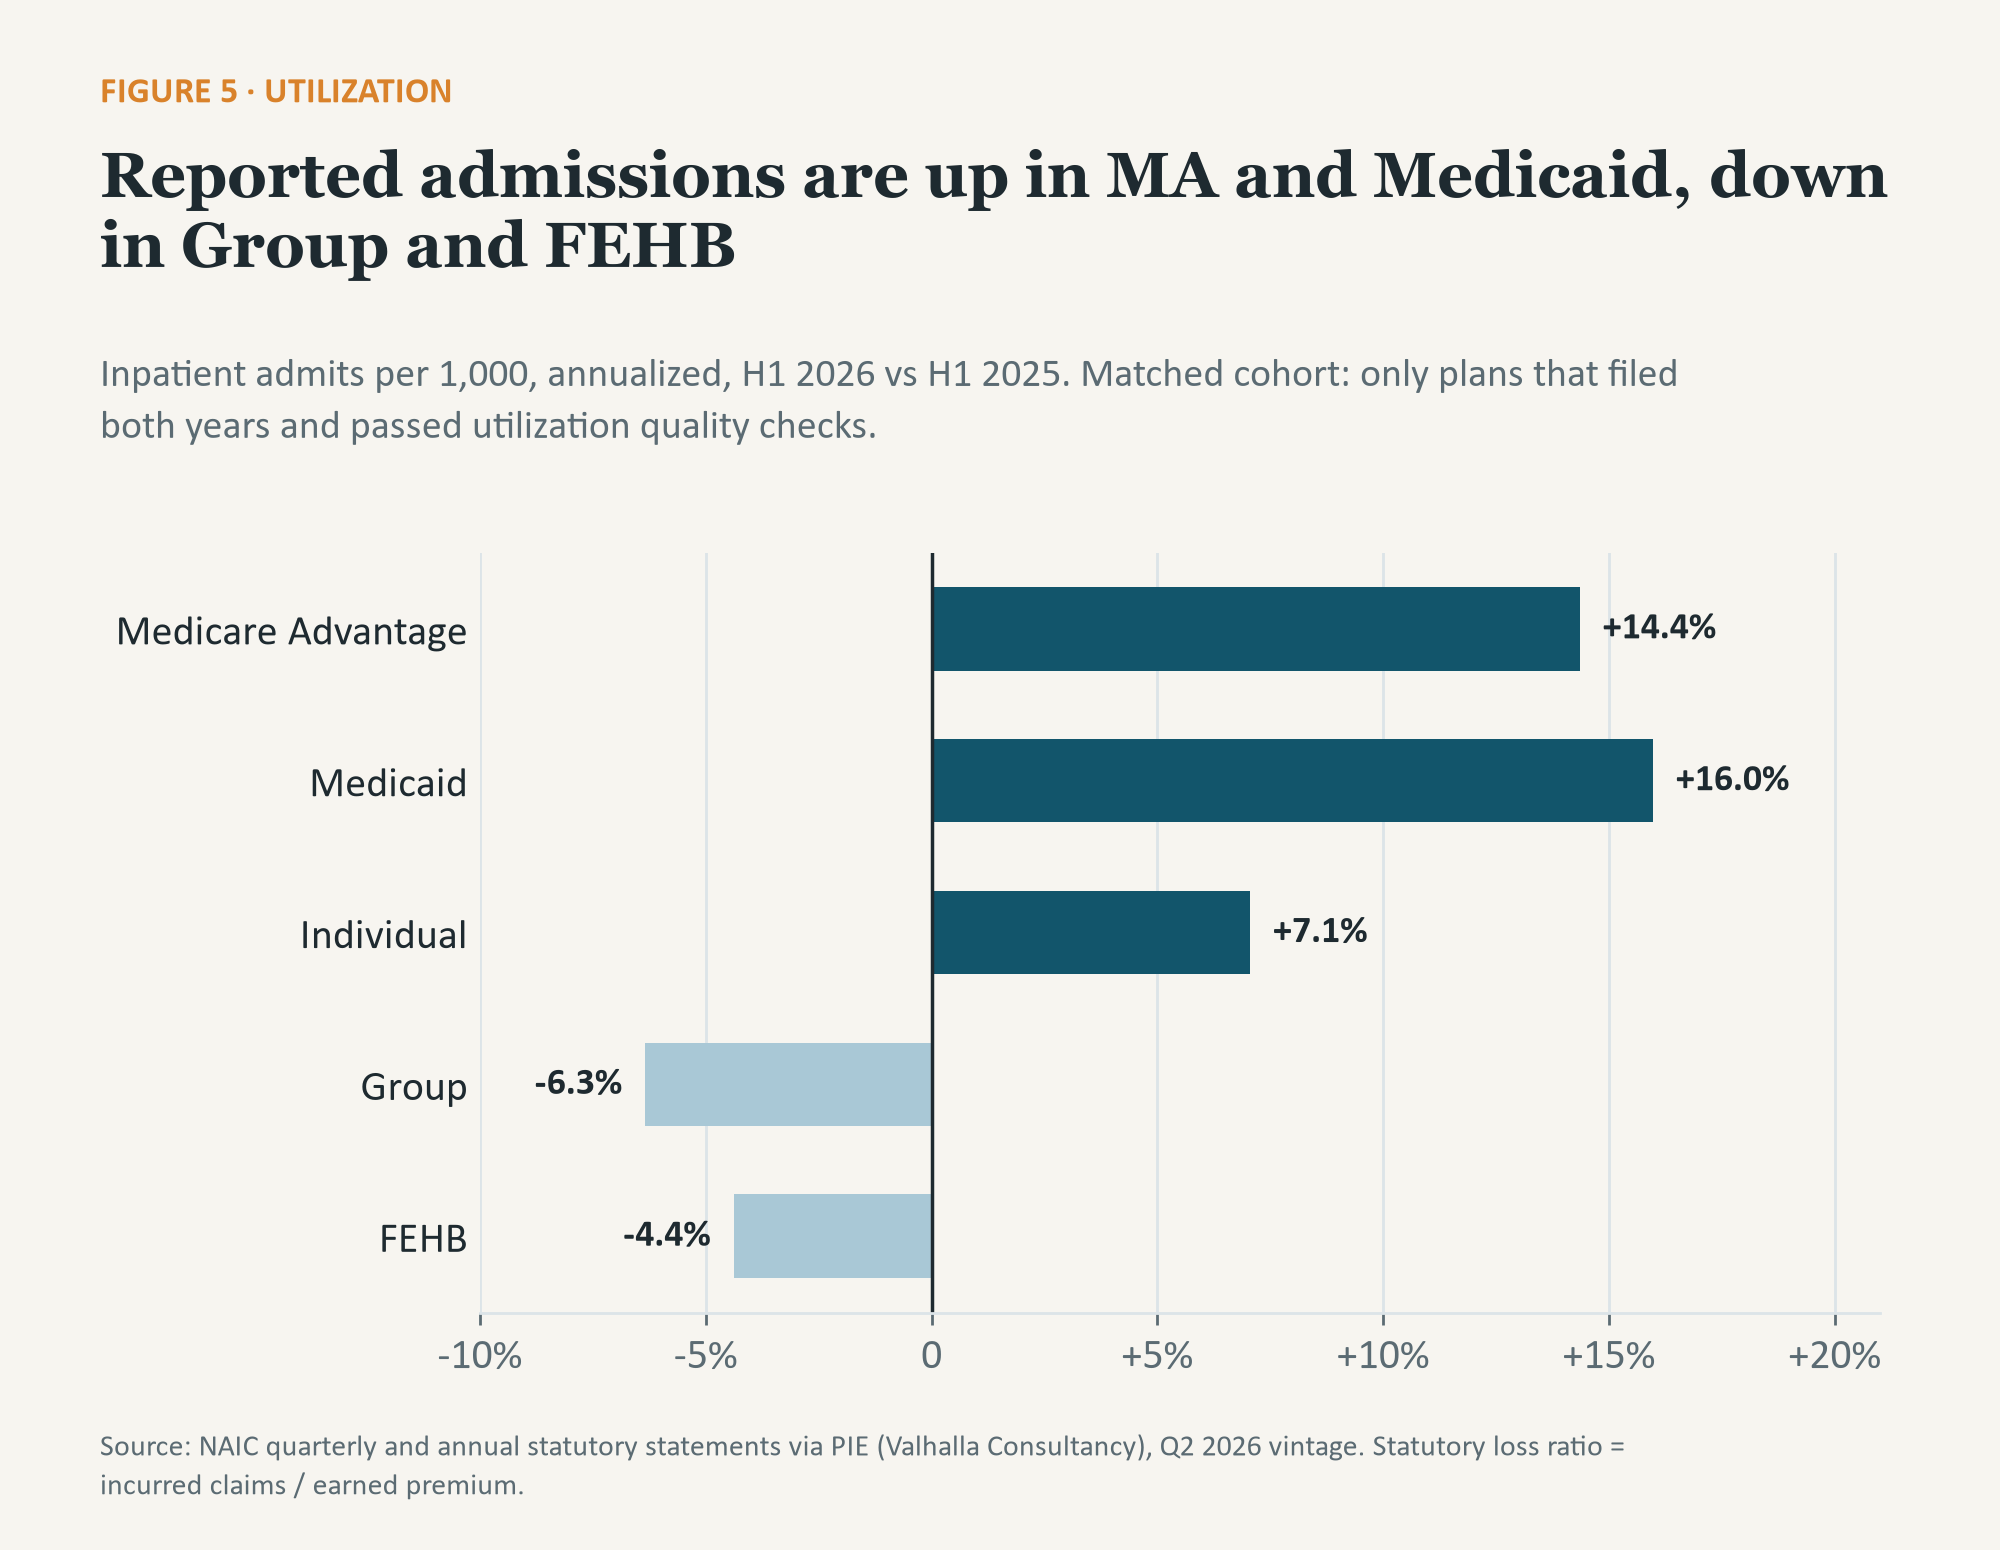
Across the five lines, inpatient admissions per 1,000 members rose from 113.9 in H1 2025 to 129.0 in H1 2026, a 13% increase. Holding last year’s membership mix constant, the increase is still about 11%, so it is not simply more members in higher-use segments. It is also not broad: on a like-for-like basis, admissions rose in Medicare Advantage (14%), Medicaid (16%) and Individual (7%), and fell in Group (6%) and FEHB (4%).
When we looked at which parent organizations moved the Medicare Advantage and Medicaid rates, one stood out. A single large national carrier, about 30% of Medicare Advantage covered lives and 14% of Medicaid, reported inpatient admissions per 1,000 that rose from 150 to 255 in Medicare Advantage and from 70 to 145 in Medicaid. Its cost per member rose 4% and 11% over the same period.
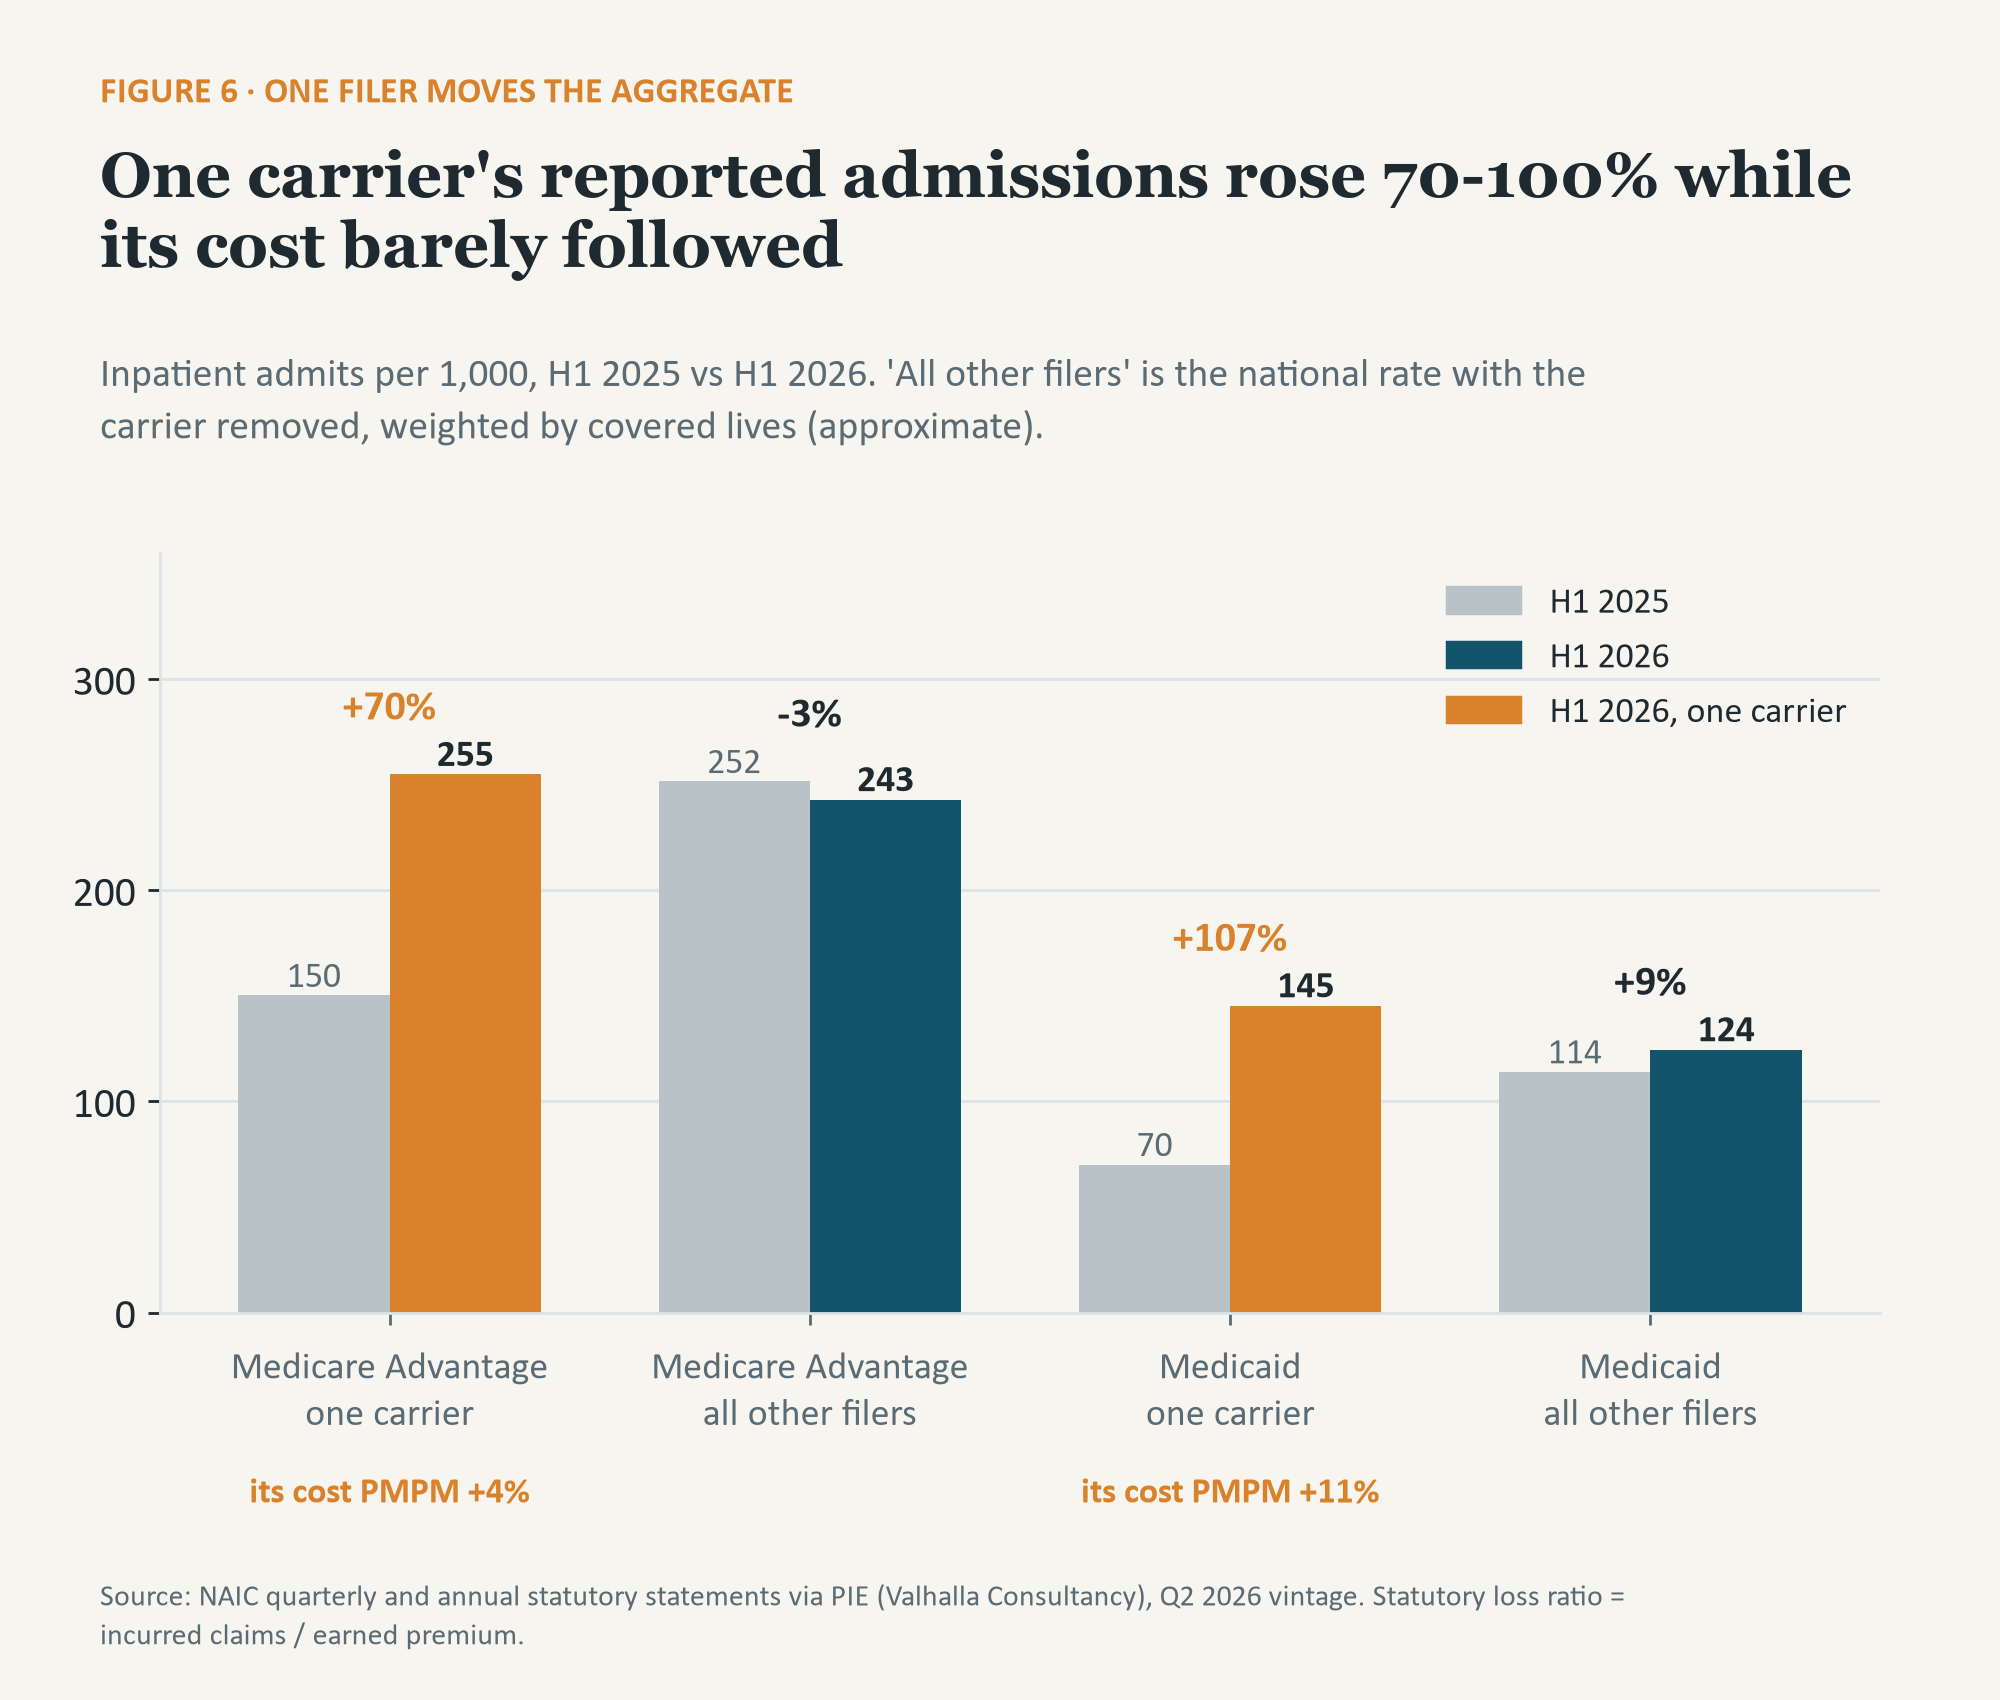
A 70% rise in hospital admissions with a 4% rise in cost looks more like a change in what is being counted than a change in care. A shift in how short stays or observation cases are classified, or a change in reporting systems, would produce this pattern. We have not confirmed the cause with the carrier.
Excluding that carrier, Medicare Advantage admissions per 1,000 went from about 252 to 243, a decline of roughly 3%. Medicaid is different: excluding the same carrier, admissions still rose about 9%, from 114 to 124, while Medicaid cost per member rose 12% overall. The Medicaid utilization increase seems real.
5. Membership shifted, but the shift does not explain the improvement
Enrollment moved noticeably between the second quarters of 2025 and 2026. Individual covered lives fell about 20%, Medicaid about 5% and FEHB about 3%. Medicare Advantage grew about 3%. Group grew about 4% on paper, but much of that is one parent reclassifying a book of business into the Group line, so we do not read it as growth.
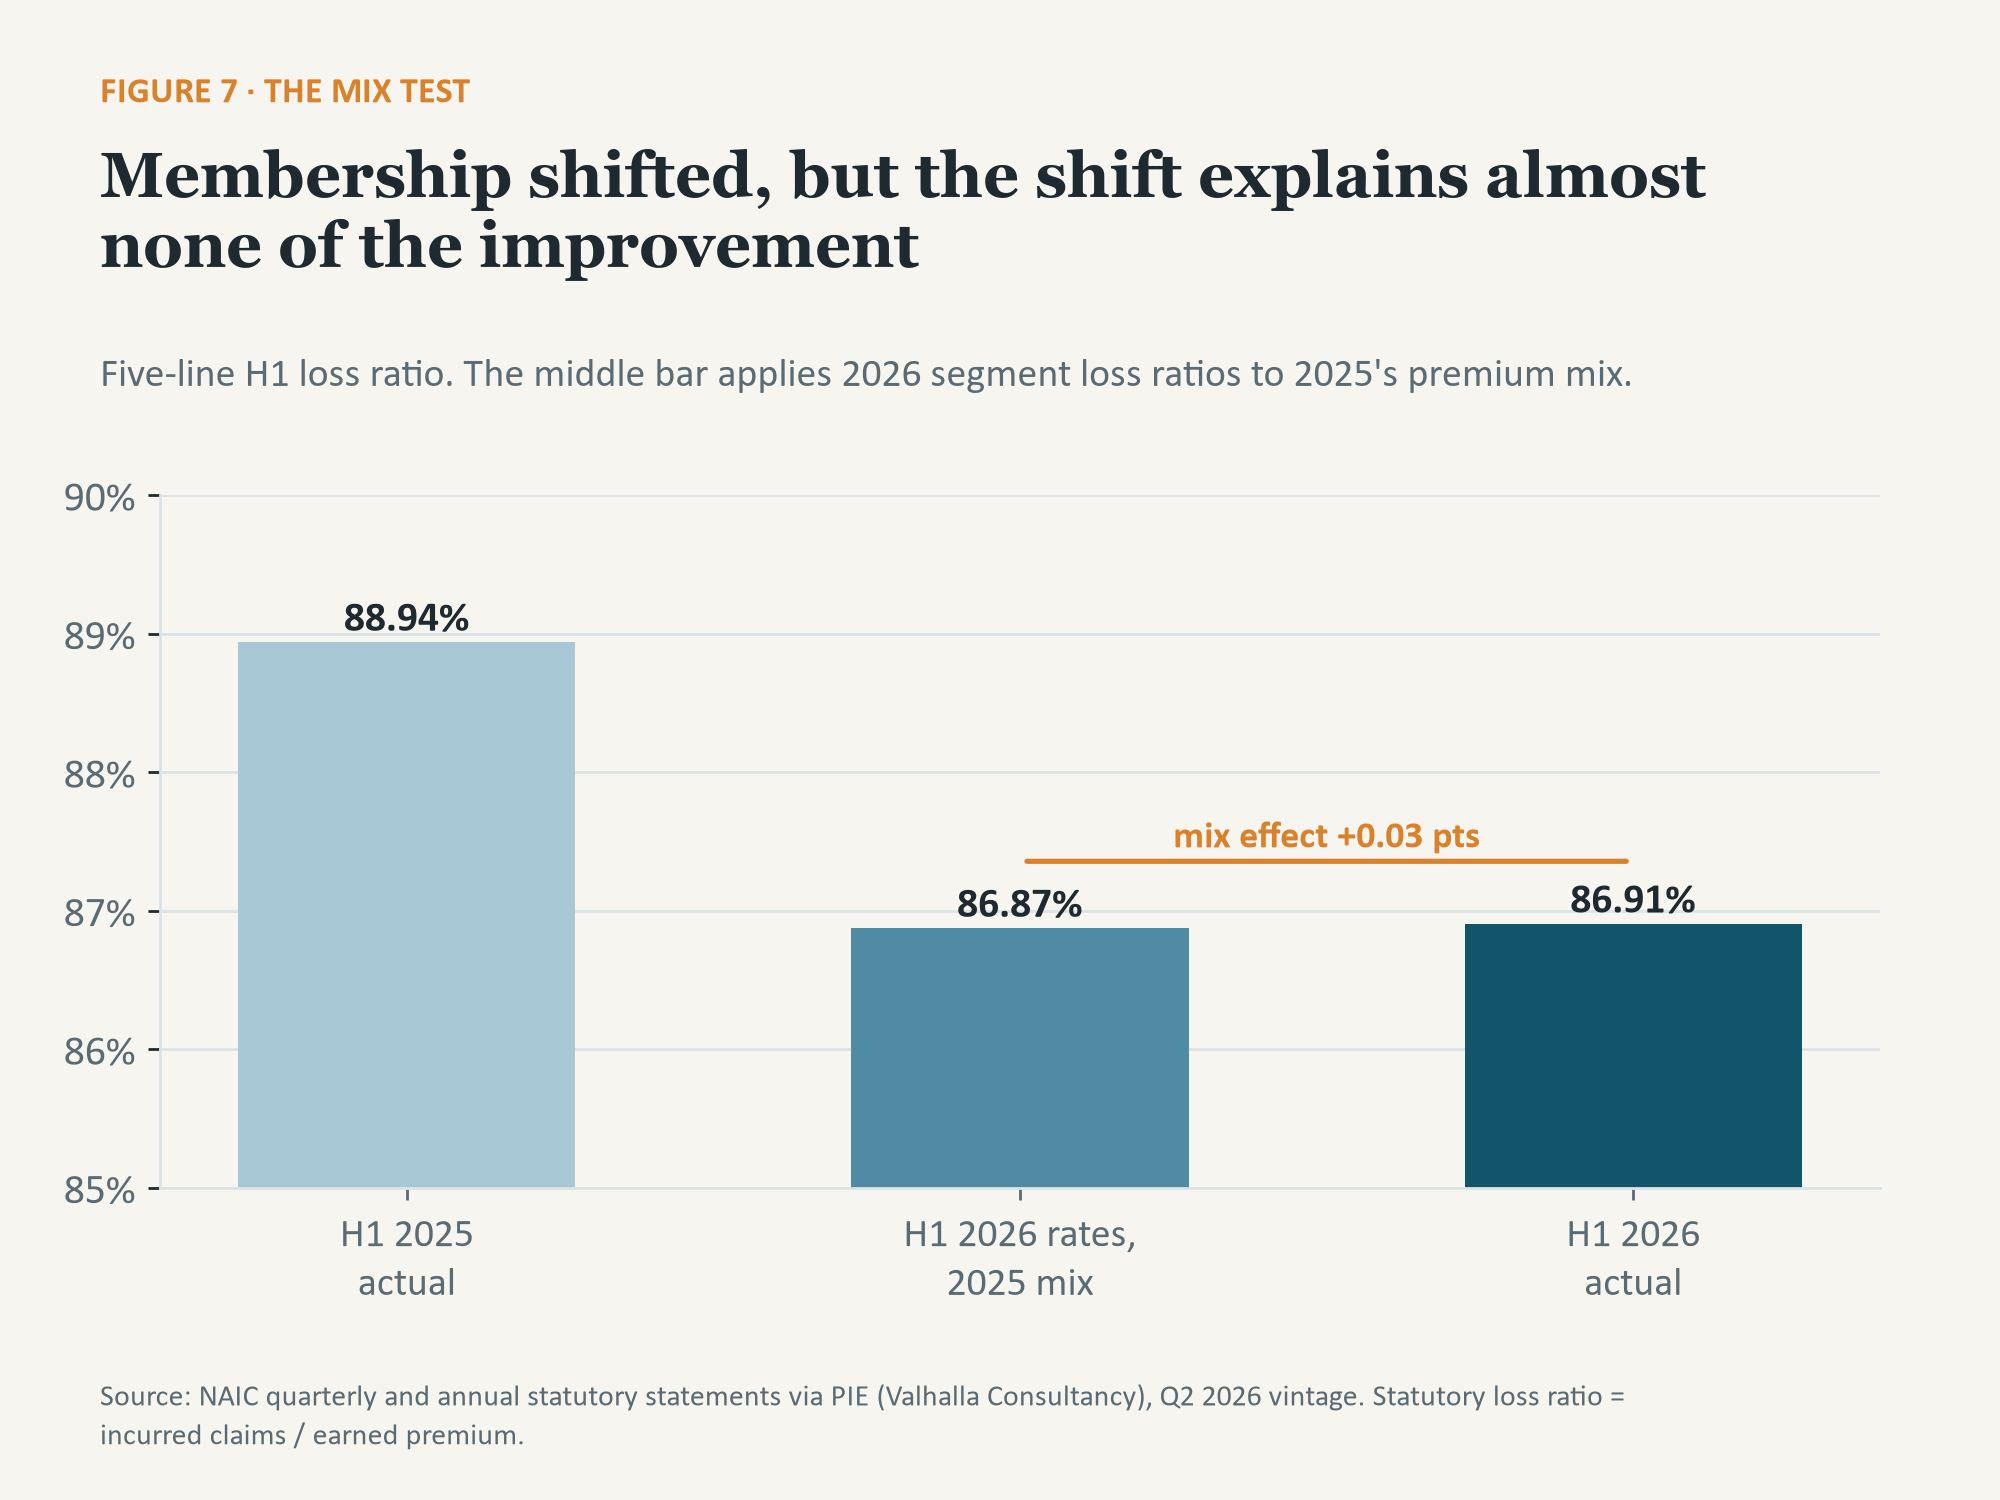
A reasonable guess would be that shrinking segments pulled the combined loss ratio down. We tested it by applying each segment’s 2026 loss ratio to 2025’s premium mix. The answer is 86.87%, against an actual 86.91%. The mix effect is 0.03 points. Almost all of the 2-point improvement happened within the segments.
6. Where the year may land
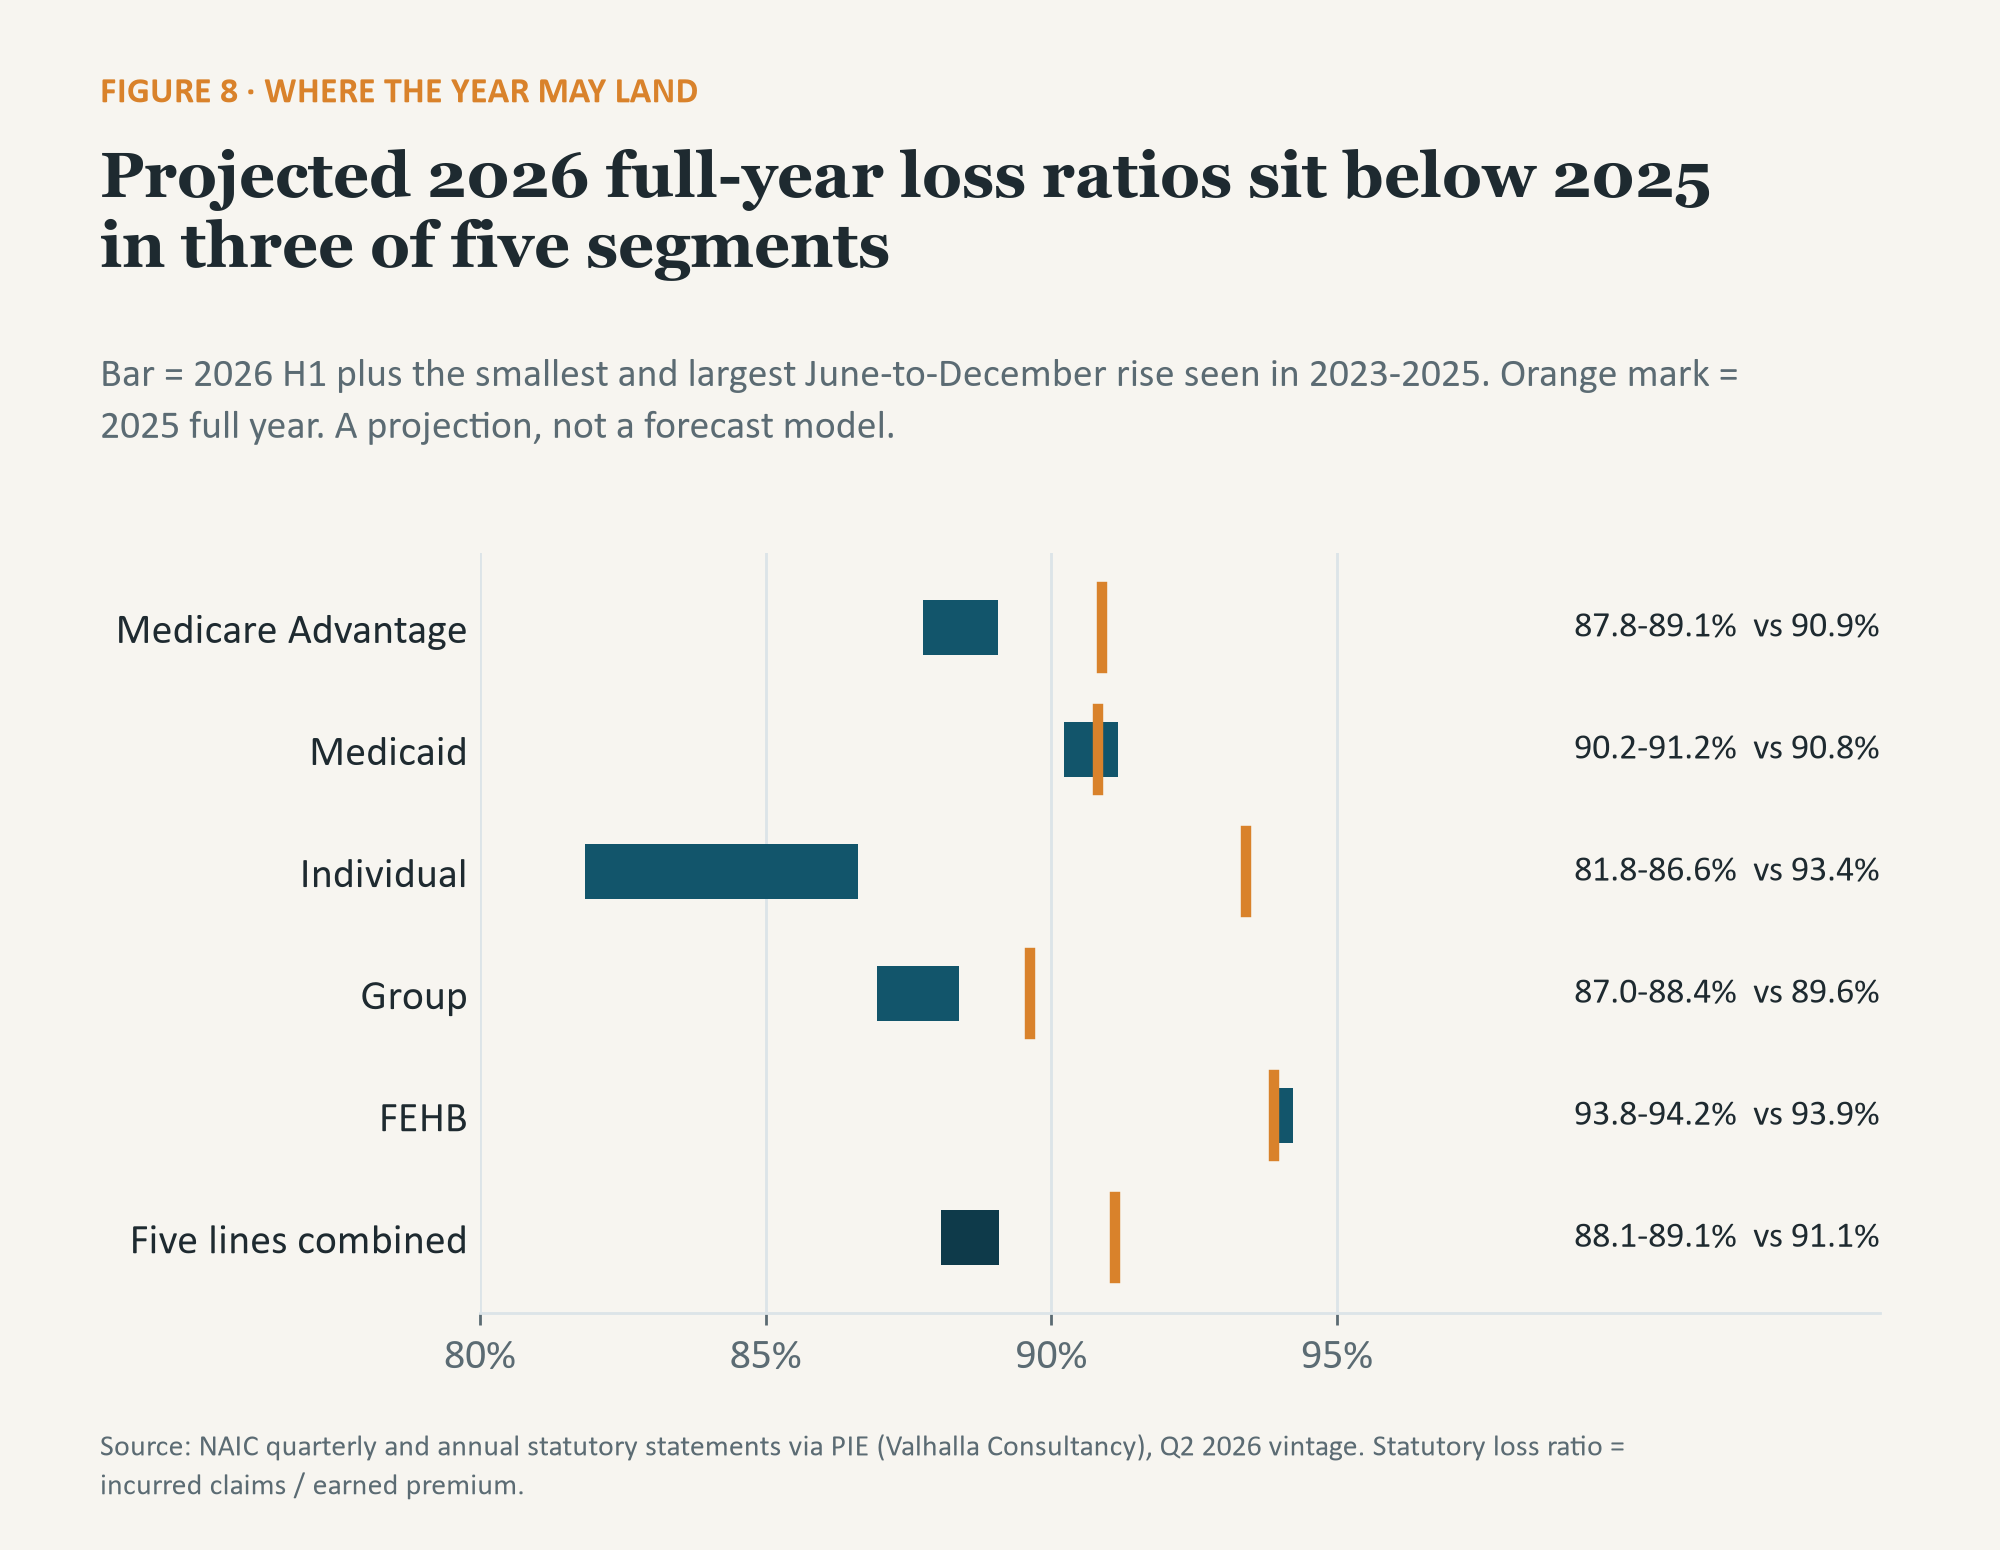
To project the full year, we added the smallest and largest June-to-December rise from 2023, 2024 and 2025 to each segment’s first half of 2026. For the five lines combined, that gives 88.1% to 89.1%, against 91.1% for 2025, or roughly 2 to 3 points better. By premium weight, Medicare Advantage and Individual account for most of that improvement.
The range is widest for Individual, 81.8% to 86.6% against 93.4% in 2025, because its second half has deteriorated more each year: the loss ratio rose 2.0 points after June in 2023, 4.5 in 2024 and 6.8 in 2025. Medicaid and FEHB project roughly flat to 2025. Group projects 1 to 3 points better, Medicare Advantage 2 to 3.
This is simple arithmetic on three years of history, not a model of claims development. It assumes the second half of 2026 behaves like one of the last three.
7. What we are not saying
We are not saying the cycle has turned for good. Half a year of statutory filings is IBNR-heavy: the June figures include estimates of claims not yet reported, and those estimates get revised. The strongest rebuttal to this piece is that 2025 also looked manageable at midyear, and Individual then added 6.8 points after June. This is why the projection is a range and why we will flag Individual as the segment most likely to break it.
We are not saying why premium is outpacing cost. Pricing actions, benefit changes and enrollment shifts would all show up the same way in these filings, and the quarterly statements cannot separate them. We are also not claiming to know why one carrier’s reported admissions changed; the filings show the pattern, not the cause at this point in the year.
Feedback
If you see a control we should add, a confound we have not ruled out, or a place where the filings read differently to you, we want to hear it. Give us feedback at research@vhallaconsult.com.
Subscribe to get the Q3 update when it is published.
Methodology notes
· Data: NAIC quarterly Exhibit of Premiums, Enrollment and Utilization (Q1-Q3) and annual State Page grand-total rows (Q4), 2023 through Q2 2026, latest vintage per filing (Q2 2026 vintage X26Q2014). Processed through PIE.
· Coverage: 879 entities filed a Q2 2026 statement, 97% of the Q2 2025 count; 707 reported business in at least one of the five lines.
· Segments: NAIC lines Title XVIII Medicare (Medicare Advantage; stand-alone prescription drug entities excluded by name), Title XIX Medicaid, Individual Comprehensive, Group Comprehensive and FEHBP. ‘Five lines combined’ sums claims, premium and member months across the five before dividing.
· Loss ratio: statutory, incurred claims divided by earned premium. It is not the ACA medical loss ratio.
· H1 figures are year to date through June as filed. Full-year figures come from the annual statement. PMPM = per member per month; covered lives = member months divided by months elapsed.
· Utilization: inpatient admissions per 1,000, annualized (admissions x 12,000 / member months). Plans flagged by PIE’s utilization quality checks, or reporting no admissions, are excluded from utilization rates only.
· Matched cohort: entity and segment pairs with a Q2 filing in both 2025 and 2026; covers 96% of five-line covered lives in H1 2026.
· One-carrier adjustment (ours): national rate minus the carrier’s rate, weighted by covered lives. Approximate, because the national utilization rate is weighted by the member months of quality-passing plans.
· Mix test (ours): 2026 segment loss ratios weighted by 2025 H1 premium shares, compared with the actual 2026 combined loss ratio.
· Projection (ours): 2026 H1 loss ratio plus the minimum and maximum June-to-December change observed in 2023, 2024 and 2025, by segment.
· Restatements: the Q1 2026 figures in this piece may differ slightly from our July Q1 recap because carriers refiled some Q1 statements.
Sources
· National Association of Insurance Commissioners (NAIC). Health quarterly statements, Exhibit of Premiums, Enrollment and Utilization, 2023 Q1 through 2026 Q2.
· NAIC. Health annual statements, State Page (Exhibit of Premiums, Enrollment and Utilization), 2023-2025.
· Valhalla Consultancy. PIE (Payer Intelligence Engine) quarterly derived tables and analysis, September 2026.
Independent analysis of public data by Valhalla Consultancy. Not affiliated with, or endorsed by, any named entity.